What I Did in January

January turned out to be a good time for tidying up my gitHub repos, because it was cold and there was no incentive to travel, and I had to quarantine for a few days in the midst of it (no symptoms, thankfully). As a result, I updated a few things. All of this is going into my connected devices class this semester.

Just enough HTML for Connected Devices – If a device connects to your phone or laptop, you’re going to need to build an interface for it at some point, and the Document Object Model (HTML/CSS/JavaScript) is a quick way to do it. I put together some examples for various ways to do that. Most of this is a thin wrapper around the Mozilla Developer Network pages, with a focus on connecting. A couple of highlights:

MQTT Examples – I’ve been working on this one since last summer in bits and pieces, but now there’s enough there to be useful. All microcontroller examples were written with the Arduino Nano 33 IoT, though any of the WiFi-enabled Arduinos should do the trick. The browser-based stuff is all in p5.js, but I’ll add some plain vanilla JS examples soon. There are some nice GUI tools available now too, like MQTT Explorer and shiftr.io’s desktop broker. My favorite example in this repo is the WebMIDI to MQTT examples.

Websocket Examples – nothing special here, but the topic comes up enough that having a set of examples on hand was something I needed. Easy to compare and contrast Websockets and MQTT now too. A lot of folks don’t know the ArduinoHTTPClient library can also do websockets, so I threw that in.

Pi Recipes – this is an older repo, but I updated it to make it a bit easier to find things. Quite pleased with the timelapse webcam example that Nun Tansrisakul inspired me to write.

WiFi101/WiFiNINA Examples – another older repo, but a bit better organized now, I hope. Moved some things to their own repos when it was merited.

Display Examples – still working on this one, but I got obsessed with making QR code examples from an Arduino, so I wrote something using Richard Moore’s arduino qrcode library, then duplicated it for ePaper, TFT, and OLED screens. Figured it was as good a time as any to put together what experience I have working with screens and microcontrollers.

HID Examples – not prettied up yet, but put together a few more notes on using the HID examples for Arduino.

Node Examples – also not prettied up yet, but added notes for using these on Glitch or on a CLI.

Serial Communication: Sending a 10-Bit (or two-byte) Value

When communicating between a microcontroller and a personal computer using asynchronous serial communication, you often need to transmit a value that is greater than 255. For example, if you want to send the value from a 10-bit analog-to-digital converter (e.g. the result from the Arduino analogRead() command) as a binary value, here’s how you do it:

int sensor = analogRead(A0);

The int data type of this variable takes multiple bytes in the Arduino’s memory. Reading the value 1023 from the ADC, for example, this is the arrangement of the bits in the bytes in memory:

first bytesecond byte
Bit values of the byte:0 0 0 0 0 0 1 11 1 1 1 1 1 1 1
Decimal value of the byte3255

To separate the original value into two bytes, you divide by 256 to get the first byte, and take the remainder (or modulo) to get the second byte. For example, 1023 / 256 = 3, remainder 255. You can see this in the Arduino code below. To send this value as two bytes from Arduino, you do the following:

 // get a 10-bit ADC value:
  int sensor = analogRead(A0);
  // divide by 256 to get the first byte:
  // (result is an integer):
  byte firstByte = sensor / 256;
  // modulo by 256 to get the second byte:
  byte secondByte = sensor % 256;
  // send the first of the two bytes:
  Serial.write(firstByte);
  // send the second of the two bytes:
  Serial.write(secondByte);

When you receive this on the personal computer, you need to combine the two bytes back into a single value. To do this, you multiply the first byte by 256, then add the second byte. For example, 3 * 256 + 255 = 1023. Here’s how to do it in p5.js using p5.serial;ort:

  // wait until you have two bytes:
  if (serial.available() >= 2) {
    // read the first byte:
    var highByte = serial.read();
    // read the second byte:
    var lowByte = serial.read();
    // combine them into a single value:
    var result = (highByte * 256) + lowByte;
    // put the result in the text div:
    console.log("high byte: " + highByte +
      "  low byte: " + lowByte +
      "  result: " + result);
  }

Here are the two full sketches for both Arduino and p5.js:

Arduino:

void setup() {
  Serial.begin(9600);
}

void loop() {
  // get a 10-bit ADC value:
  int sensor = analogRead(A0);
  // divide by 256 to get the first byte:
  // (result is an integer):
  byte firstByte = sensor / 256;
  // modulo by 256 to get the second byte:
  byte secondByte = sensor % 256;
  // send the first of the two bytes:
  Serial.write(firstByte);
  // send the second of the two bytes:
  Serial.write(secondByte);
}

The p5.js sketch:

// variable to hold an instance of the serialport library:
let serial;
// HTML Select option object:
let portSelector;


function setup() {
  // new instance of the serialport library
  serial = new p5.SerialPort();
  // callback function for serialport list event
  serial.on('list', printList);
  // callback function for serialport data event
  serial.on('data', serialEvent);
  // list the serial ports
  serial.list();
  textDiv = createDiv('result will go here.')
}

// make a serial port selector object:
function printList(portList) {
  // create a select object:
  portSelector = createSelect();
  portSelector.position(10, 10);
  // portList is an array of serial port names
  for (var i = 0; i < portList.length; i++) {
    // add this port name to the select object:
    portSelector.option(portList[i]);
  }
  // set an event listener for when the port is changed:
  portSelector.changed(mySelectEvent);
}


function mySelectEvent() {
  let item = portSelector.value();
  // give it an extra property for hiding later:
  portSelector.visible = true;
  // if there's a port open, close it:
  if (serial.serialport != null) {
    serial.close();
  }
  // open the new port:
  serial.open(item);
}


function serialEvent() {
  // if you have received two or more bytes:
  if (serial.available() >= 2) {
    // read the first byte:
    var highByte = serial.read();
    // read the second byte:
    var lowByte = serial.read();
    // combine them into a single value:
    var result = (highByte * 256) + lowByte;
    // put the result in the text div:
    console.log("high byte: " + highByte +
      "  low byte: " + lowByte +
      "  result: " + result);
  }
}

Here’s the index.html page:

<!DOCTYPE html><html lang="en"><head>
  <script src="https://cdnjs.cloudflare.com/ajax/libs/p5.js/1.1.9/p5.min.js" integrity="sha512-WIklPM6qPCIp6d3fSSr90j+1unQHUOoWDS4sdTiR8gxUTnyZ8S2Mr8e10sKKJ/bhJgpAa/qG068RDkg6fIlNFA==" crossorigin="anonymous"></script>
  <script language="javascript" type="text/javascript" src="https://cdn.jsdelivr.net/npm/p5.serialserver@0.0.29/lib/p5.serialport.js"></script>
    <meta charset="utf-8">
  </head>
  <body>
    <script src="sketch.js"></script>
</body></html>

You will also need the p5.serialcontrol app to connect the sketch in a browser to the serial port.

Glitch and p5.js and p5.serialport

David Bouchard of Ryerson University gave me a great tip: Glitch.com works well for p5.js projects. It’s a nice alternative to the p5.js editor, particularly because it supports sharing of live code. This can be handy when you’re working remotely with others. This means you and your remote partner can both be typing in the same sketch in real-time (well, network real-time).

It even works with p5.serialport library and the p5.serialcontrol app if you want to work on p5.js sketches that require asynchronous serial input. Each person sharing the sketch will be running a local instance of the sketch in their own browser. This means they will be able to connect with their local copy of p5.serialcontrol, to communicate with their own serial ports.

Here are the steps to make a p5.js serialport app work:

  • Set up a Glitch account if you don’t already have one.
  • Make a new project in Glitch. Use the “Hello Webpage” option
  • Replace the default HTML with the following:
<!DOCTYPE html><html lang="en"><head>
  <script src="p5.min.js"></script>
  <script src="p5.serialport.js"></script>
  </head>
  <body>
    <script src="sketch.js"></script>
</body></html>
  • Replace the two script tags with the latest CDN links for p5.js and p5.serialport.js. The p5.js CDN can be found at this link. The p5.serialport latest version is 0.0.29, as of this writing:
<script src="https://cdn.jsdelivr.net/npm/p5.serialserver@0.0.29/lib/p5.serialport.js"></script>
  • Replace the script.js file with a file called sketch,js and make it a p5.js sketch. Here’s the minimum:
function setup() {
  
}

function draw() {
 
}
  • Download the p5.serialcontrol app, connect to a microcontroller over a serial port, and you’re ready to go.
  • Once you’ve made your sketch click Share -> Code and share that link with your remote partner. That’s it! You’re ready to go.

To test this, I made a sketch that creates a serialport object, then gets the list of serial ports and makes a select menu so you can choose the serial port. Feel free to use it.

This Week in Code: MQTT Fun

Work’s been quite busy lately, with several things going on at once, and few things completed. Many pieces of what I am doing are scattered over the web, on my gitHub account, my various class sites, etc. Since I’m expecting students to keep a blog in my classes, I thought it might be useful to revive my own blogs as a place to keep track of some of the projects I’m in the midst of.

I’ve been having a good time making examples using the Message Queueing Telemetry Transfer (MQTT) protocol lately. MQTT is a lightweight networking protocol used in many industrial networking (read: internet of things) applications. There are a number of good libraries out there for it on a variety of platforms, and a couple of useful public brokers (read: servers) that you can test your apps with, like shiftr.io and mosquitto.org. I like Shiftr because of the fancy motion graphic (okay, call me shallow). I’ve got examples for Arduino using the ArduinoMqttClient library and p5.js using the Eclipse PAHO library. I just added one using p5.serialport as well, so you can connect Arduino projects to each other through p5.serialport -> p5.js -> MQTT.

Dealing with the Zoom Overheat

Today’s adventure in working from home: my machine has been overheating because of running Zoom, a browser full of tabs, Arduino, VS Code, and a few other things. I got the overheat notice on my mac several times, and finally a message I’d never seen, that the mac had to shut down because of the heat.

It’s not just Zoom’s fault, it’s also the fact that my desk is in the sun for a couple hours at midday. But still, after opening the lid (I use an external monitor) and fanning it as I worked, I finally found a solution out of desperation: I put a gel-filled icepack under the laptop. It kept the laptop cool enough to finish the last meetings, and to make a couple videos. Not bad.

In the process, I also learned a new macOS command line tool: powermetrics. You have to run it using sudo:

$ sudo powermetrics

The results are useful, especially this part:

**** SMC sensors ****

CPU Thermal level: 0
IO Thermal level: 0
CPU die temperature: 53.55 C
CPU Plimit: 0.00
GPU Plimit: 0.00
Number of prochots: 0

Living without Solder

Time to dust off the blog, as a place to put things that don’t belong anywhere else during this quarantine. New York City’s closed all essential businesses, including my university, so like much of the world at the moment, I am working from home. This means a desk littered with electronic parts. It also means having to build circuits with no soldering iron, since I left it at the university.

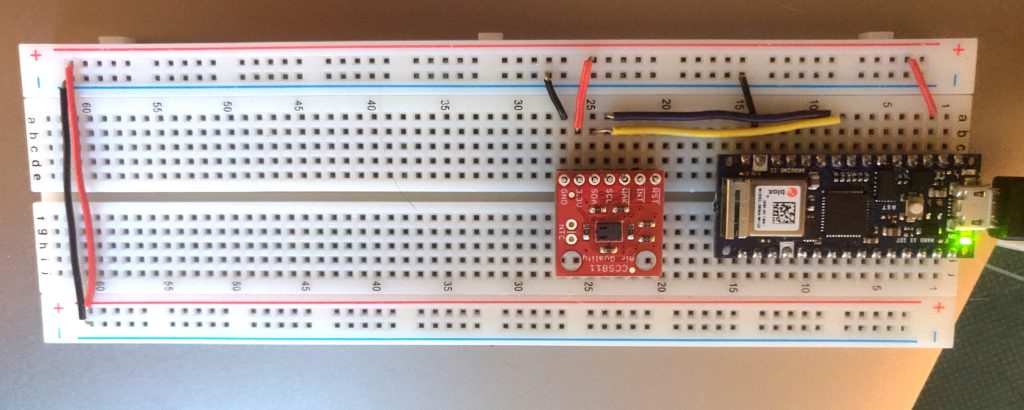
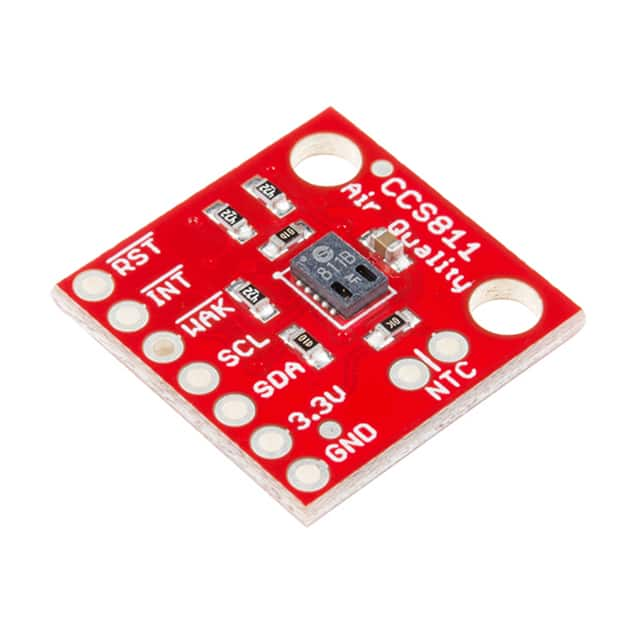
For many parts, no solder is no problem, but what do you do with something like your typical breadboard breakout board like this air quality sensor from Sparkfun? I could switch my whole system to other components like Grove or Qwiic, but that limits my options in terms of selection, and most importantly, I want to keep working with the through-hole components I’ve already got.

Figure 1. CCS811 Air Quality Meeting from Sparkfun.
Figure 1. CCS811 Air Quality Meeting from Sparkfun. It has holes for 0.1-inch spaced pins, but no header pins.

The answer: friction-fit header pins. These header pins have a loop at the tip that can be pushed tight into a typical header pin hole, forming a tight mechanical contact. They’re not perfect, and I will go back to soldering when I can, but for now, they’ll do the job.

Figure 1. Press-fit header pins, 0.1" spacing.
Figure 2. Press-fit header pins, 0.1″ spacing.

Here are two press-fit options from Digikey, who seem to still be delivering at the moment:

My other non-solder solution when I need to make a board I can throw around a bit is to use 22 AWG solid-core wires instead of stranded jumper wires. These used to be the standard for me, but in the past nine or ten years, flexible jumpers have taken over the maker electronics world. But they come out too easily, and if you’ve got a lot of clutter on your desk, they make for boards that easily get ruined. By cutting solid wire exactly to length and laying it flat on the board, you can make a more solid board. I usually keep at least red, black, blue, and yellow options in stock.

Figure 3. A solderless breadboard with Arduino 33 IoT and CCS811 air quality sensor.
Figure 3. A solderless breadboard with Arduino 33 IoT and CCS811 air quality sensor. The wires connecting the components are 22AWG solid-core, custom cut to length. The CCS811 has press-fit headers. It’s not as robust as a soldered board, but it’ll stay together longer than one done with jumper wires.

MKR GSM 1400 Pre-flight Checklist

I’ve been getting to know the MKR GSM 1400 boards better the past few days, and in the process I’ve assembled a “pre-flight checklist” of things you’ll want to do first, in order to make sure everything is ready to go. It took a few errors and missteps to get here, so I’ll mention those along the way.

Make sure you have an antenna attached

I thought “I’ll be fine just to test, there’s good service in my city.” Wrong. Attach an antenna. You’ll need it to get a good signal even in a well-covered area. The GSM Antenna sold on the Arduino Store works well, though any GSM antenna with a SMA male connector should work.

Get a SIM card

I used Hologram.io, thanks to recommendations from the rest of the Arduino team and Don Coleman. Their Hologram Maker Edition service is affordable and easy to use. When you do set up an account, get a SIM card of course, and assign a phone number to it. That’s optional for their service, but needed if you want to send and receive SMS messages or phone calls.

You’ll also want to take note of the Device ID, APN info, and Device Key. You’ll need those later. When accessing GPRS services through the MKR 1400, the login is the Device ID and the password is the Device Key.

Download MKRGSM library

You can find this in the Arduino IDE’s LIbrary Manager. When you install it, you’ll get a new set of example sketches in the File Menu, Examples submenu called MKRGSM. You’ll need to have the right board chosen in the Tools menu (MKR 1400) in order for these examples to show up in the Examples submenu, though.

Run the TestModem Sketch

Click the File Menu, Examples submenu, MKRGSM submenu, Tools submenu to find the TestModem sketch. Upload this to your board and open the Serial Monitor. You should get the following output:

Starting modem test…

Then a slight delay, followed by:

modem.begin() succeeded
Checking IMEI…Modem's IMEI: XXXXXXXXXXXXXXX
Resetting modem…Modem is functoning properly

Your IMEI will be unique to your board, it’s the International Mobile Equipment Identifier. It’s written on the MKR1400, and encoded in the QR code there as well.

If you don’t get these messages, check that your SIM card is inserted properly, and that you’ve chosen the right board and serial port. Then upload the sketch again.

Run the BandManagement sketch

Click the File Menu, Examples submenu, MKRGSM submenu, Tools submenu to find the BandManagement sketch. Upload this to your board and open the Serial Monitor. You should get the following output:

Restarting modem…

Then a slight delay followed by:

Modem restarted.
Current band:EGSM_DCS_MODE
Want to change the band you’re on?
Select band:
1 : E-GSM(900)
2 : DCS(1800)
3 : PCS(1900)
4 : E-GSM(900)+DCS(1800) ex: Europe
5 : GSM(850)+PCS(1900) Ex: USA, South Am.
6 : GSM(850)+E-GSM(900)+DCS(1800)+PCS(1900)

Choose the right band for your region of the world. If you pick the wrong region, the MKR1400 will never connect to a network. I puzzled over this for several minutes before I thought to check the band, as I was in the US and the board came from Europe. Type the correct number in the Serial Monitor’s input field, then hit enter. You should get:

Configuring band GSM850_PCS_MODE

Or whatever mode is appropriate to your region. Then after a few seconds:

Success

Run the ScanNetworks sketch

Click the File Menu, Examples submenu, MKRGSM submenu, Tools submenu to find the GsmScanNetworks sketch. If your SIM card requires a PIN, enter it in the arduino_secrets.h tab. Upload this to your board and open the Serial Monitor. You should get the following output:

GSM networks scanner

Then a longer delay followed by:

Modem IMEI: XXXXXXXXXXXXXXX
Scanning available networks. May take some seconds.
Current carrier: T-Mobile
Signal Strength: 5 [0-31]
Scanning available networks. May take some seconds.
Current carrier: T-Mobile
Signal Strength: 5 [0-31]
Scanning available networks. May take some seconds.

This should be the first sketch that connects your MKR 1400 to the mobile network, so make sure you have an antenna attached. Your carrier name and signal strength will vary, of course. The scanning will run continually.

Once you see this, you know you’re on the mobile network. Now the fun begins.

Run the SendSMS sketch

Click the File Menu, Examples submenu, MKRGSM submenu, to find the SendSMS sketch. If your SIM card requires a PIN, enter it in the arduino_secrets.h tab. Upload this to your board and open the Serial Monitor. You should get the following output:

SMS Messages Sender

Then a delay followed by:

GSM initialized
Enter a mobile number:

Type your mobile phone number into the Serial Monitor’s input field, including the country code. For example, a typical US number would be +15551212. Then type enter. You should get the following output:

+15551212
Now, enter SMS content:

Type a message, something like this:

I like aardvarks and okapi, don't you too?

You should get the following output:

Message:
I like aardvarks and okapi, don't you too?

COMPLETE!

Enter a mobile number:

You should get the text on your phone number too, of course. Note that the sending phone number may not be the one associated with your SIM. This will depend on your carrier. Send a few more until you’ve exhausted that fun.

Run the ReceiveSMS sketch

Click the File Menu, Examples submenu, MKRGSM submenu, to find the ReceiveSMS sketch. If your SIM card requires a PIN, enter it in the arduino_secrets.h tab. Upload this to your board and open the Serial Monitor. You should get the following output:

SMS Messages Receiver

Then a delay followed by:

GSM initialized
Waiting for messages

Send a text message from your mobile phone to the number associated with your SIM card. You should get the following output:

Message received from:
+15551212
Oh, and llamas and bonobos are quite nice too.
END OF MESSAGE
MESSAGE DELETED

Now you know you’re successfully sending and receiving messages from the mobile network. Finally, test GPRS connectivity:

Run the GsmSSLWebClient sketch

Click the File Menu, Examples submenu, MKRGSM submenu, to find the GsmSSLWebClient sketch. Click the arduino_secrets.h tab and enter your APN info, login, and password. From Hologram.io, you hologram for the APN, use the Device ID as login and generate a Device Key as password. Hologram SIMs do not require a PIN. Check with your mobile provider for details on your own SIM. Upload this to your board and open the Serial Monitor. You should get the following output:

Starting Arduino web client.

Then a longer delay followed by:

connecting…
connected
HTTP/1.1 200 OK
Server: nginx
Date: Tue, 19 Mar 2019 13:48:40 GMT
Content-Type: text/plain
Content-Length: 2263
Last-Modified: Wed, 02 Oct 2013 13:46:47 GMT
Connection: close
Vary: Accept-Encoding
ETag: "524c23c7-8d7"
Accept-Ranges: bytes
`:;;;,` .:;;:. .;;;;;;;;;;;` :;;;;;;;;;;: TM `;;;;;;;;;;;;;;;` :;;;;;;;;;;;;;;; :;;;;;;;;;;;;;;;;;; `;;;;;;;;;;;;;;;;;; ;;;;;;;;;;;;;;;;;;;;; .;;;;;;;;;;;;;;;;;;;;
;;;;;;;;:;;;;;;;;; ,;;;;;;;;..;;;;;;;; .;;;;;;, :;;;;;;; .;;;;;;; ;;;;;;; ;;;;;; ;;;;;;; ;;;;;;, ;;;;;;. ,;;;;; ;;;;;;.;;;;;; ;;;;;;
;;;;;. ;;;;;;;;;;;``` ;;;;;
;;;;; ;;;;;;;;;, ;;; .;;;;;
;;;;:;;;;;;;; ;;; ;;;;;
,;;;;,,,,,,,, ;;;;;;; .,,;;;,,, ;;;;;
:;;;;.;;;;;;;; ;;;;;, :;;;;;;;; ;;;;; :;;;; .;;;;;;;; ;;;;;; :;;;;;;;; ;;;;; .;;;;. ;;;;;;;. ;;; ;;;;; ;;;;; ;;;;;;;;; ;;; ;;;;; ;;;;; .;;;;;;;;;; ;;; ;;;;;, ;;;;;;;;;;;;;;;;;; ;;;;;
;;;;;, .;;;;;; ;;;;;;; ;;;;;; ;;;;;;: :;;;;;;. ;;;;;;; ;;;;;; ;;;;;;; .;;;;;;;, ;;;;;;;; ;;;;;;;:
;;;;;;;;;:,:;;;;;;;;;: ;;;;;;;;;;:,;;;;;;;;;;
;;;;;;;;;;;;;;;;;;;. ;;;;;;;;;;;;;;;;;;;; ;;;;;;;;;;;;;;;;; :;;;;;;;;;;;;;;;;: ,;;;;;;;;;;;;;, ;;;;;;;;;;;;;; .;;;;;;;;; ,;;;;;;;;:
;;; ;;;;;` ;;;;: .;; ;; ,;;;;;, ;;. `;, ;;;; ;;; ;;:;;; ;;;;;; .;; ;; ,;;;;;: ;;; `;, ;;;:;;
,;:; ;; ;; ;; ;; .;; ;; ,;, ;;;,;, ;; ;; ;; ;: ;; ;; ;; ;; .;; ;; ,;, ;;;;;, ;; ;;.
;: ;; ;;;;;: ;; ;; .;; ;; ,;, ;;;;;, ;; ;;
,;;;;; ;;;; ;; ;; .;; ;; ,;, ;; ;;;, ;; ;; ;; ,;, ;; .;; ;;;;;: ;;;;;: ,;;;;;: ;; ;;, ;;;;;; ;; ;; ;; ;; ;;;;. `;;;: ,;;;;;, ;; ;;, ;;;;
disconnecting.

That text will appear as the ASCII-encoded Arduino logo in your Serial Monitor. Now you know you’ve got GPRS working, and should have enough functionality to proceed with your own sketches.

The MKRGSM library is based on similar principles as the WiFi101 and WiFiNINA libraries. Once you connect to the network, you use a variety of classes to do your business. The SMS class functions a bit like the Serial class, in that it’s based on the Stream class, so you can do things like see how many bytes are available(), you can read() and write(), and so forth. The GSMClient and GSMSSLClient classes function just like the TCP client classes in the WiFi libraries. Check the MKRGSM library documentation for more detail.
HTML Interface For a Digital Multimeter

It’s been a long time since my last post on this site. Time to update it a bit.

Introduction

Recently, some colleagues of mine and I were looking for a digital multimeter that could be used by people with low or no vision. We found a pretty good low-cost Bluetooth-connected meter from General Tools, model TS-04 (credit to Pedro G.C. Oliveira for finding it). It connects to an app for iOS or Android that’s reasonably accessible with a screen reader, but I thought it’d be helpful if it were possible to build customized interfaces for it, to match the user’s abilities and preferences more closely. What follows is an explanation of the process. The final code to make it possible can be found on my GitHub account.

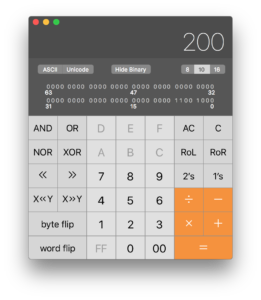
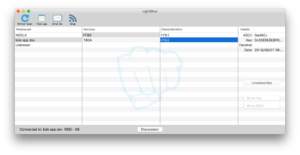
If you’re new to Bluetooth LE, check out Alasdair Allan, Don Coleman, Sandeep Mistry’s book Make: Bluetooth (available in the Maker Shed), or this introduction that we did a few years ago on gitHub. To figure out the protocol, I used Punchthrough Design’s LightBlue app on the MacOS (available in the MacOS app store) to connect to the meter, a lot of experimentation in JavaScript, and the Mac calculator, in engineering mode so I could look at the bits (press command-3 in the calculator to enter engineering mode).

Apple calculator in engineering mode (press command-3 to enter this mode). In this mode, you can view numeric results in decimal, hexadecimal, or octal modes, you can see the binary values of each number, and you can perform bitwise operations like AND and OR on numbers.

Apple calculator in engineering mode (press command-3 to enter this mode). In this mode, you can view numeric results in decimal, hexadecimal, or octal modes, you can see the binary values of each number, and you can perform bitwise operations like AND and OR on numbers.

Punchthrough's LightBlue app is a good tool for browsing BLuetooth LE peripherals. You can view a device's services and characteristics, and read from and write to them.
Punchthrough’s LightBlue app is a good tool for browsing Bluetooth LE peripherals. You can view a device’s services and characteristics, and read from and write to them.


Connecting to the Meter from JavaScript

LightBlue is useful for learning the UUIDs of Bluetooth LE peripheral devices and their services and characteristics. Once I knew those, I could connect to it using a Bluetooth LE programming environment. I chose to use Web Bluetooth (details available here) to make it easy to build an interface in HTML that could be used in a browser. Yining Shi’s example for p5.js was useful (on gitHub), as was Uri Shaked’s post on Medium (at this link). My connection code is on my gitHub repository at this link.

It’s worth noting that web Bluetooth may not be the best solution to this problem. As of this writing, it only works in Chrome, and the device discovery chooser is not accessible to some screen readers, from what I can see. I don’t believe a solution is forthcoming to that problem until it’s available in other browsers. But hopefully it will change if web Bluetooth catches on in other contexts.

The meter’s primary service uses the UUID FFB0, and has two characteristics. The first, FFB1, continually sends the ASCII string SPP:sendData 08\s\n\ which is not so useful. The second, FFB2, sends a nine-byte string of binary data that appears to change as you change the meter’s settings. I converted it to a string of numbers it with the following JavaScript function:

function handleData(event) {
var buf = event.target.value.buffer;
if (buf.byteLength >= 20 ) {
// reading characteristic FFB1:
var str = String.fromCharCode.apply(null, new Uint8Array(buf));
console.log('I got ' + str);
} else {
// reading characteristic FFB2:
console.log(new Uint8Array(buf));
}
}

The Data

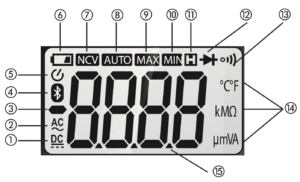
To figure out how the meter worked, I looked at the display and went through all the settings to understand what each one looked like.

The display of the TS-04 meter, showing the various functions. Image from the user manual (click image for the full manual)


Next I made a JSON model of the meter’s relevant features like so:

var meter = {
value: '', // number value
negativePolarity: '', // DC negative polarity
units: '', // what you are measuring: V, A, ?, etc.
magnitude: '', // kilo-, milli-, mega-, micro- ,etc.
acDc: '', // AC or DC, for V and A readings
setting: null, // what setting (function) you're on
hold: null, // hold current reading onscreen
autoRange: null, // autoranging feature
ncv: false // non-contact AC voltage beep
}

That gave me a data structure I could fill in that could be used for any interface I want to build.

The first and last bytes of characteristic FFB20 don’t change; the first is always 48, the last is always 1. Here’s a typical string, showing what happens when the meter’s on the voltage setting, reading 000.0 mV DC:

[48, 226, 235, 235, 251, 11, 129, 66, 1]

The remaining seven bytes are 56 bits. The display has 53 discrete symbols on it: four seven-segment numerals, three decimal points, a negative sign, and 21 assorted other symbols. It seemed logical that the 56 bits would represent the 34 symbols on the meter, so I tried all the meter settings, examining the bits using the calculator to find out. Isolating the non-numeric functions was pretty straightforward. Here’s a breakdown of the symbols I worked out for the nine bytes:

Byte 0: unchanging, always 48

Byte 1:

  • bit 4: negative sign
  • bit 2: auto-ranging
  • bit 0-1: DC/AC
    • AC: 01
    • DC: 10

Byte 2:

  • bit 4: decimal point in second digit

Byte 3:

  • bit 4: decimal point in second digit

Byte 4:

  • bit 4: decimal point in second digit

Byte 5:

  • bit 7: diode
  • bit 6: k
  • bit 4: µ
  • bit 2: NCV beep signal (middle LCD of last digit)

Byte 6:

  • bit 7: hold symbol
  • bit 5: resistance symbol
  • bit 3: continuity
  • bit 2: M
  • bit 0: m

Byte 7:

  • bit 7: NCV symbol
  • bit 6: always on; could be Bluetooth or Auto-off
  • bits 4-5: Temperature:
    • 01: F
    • 10: C
  • bit 3: low battery
  • bits 0-1: Voltage, amperage
    • 01: A
    • 10: V

Byte 8: unchanging, always 1

With those values known, I could set the properties of my meter JSON object using some bit-masking to check to see which bits were set. For example, here’s the check for auto-ranging:

// byte 1 bit 2 is autoranging:
meter.autoRange = ((data[1] & 0b100) > 0);

The other bit checks are similar. The full program is in the ble-ts04.js file.

The Numerals

The numeric data was more of a mystery. The lower four bits of bytes 2 through 5 changed with the digits as follows:

  • 0 = 1011
  • 1 = 1010 same as 7
  • 2 = 1101
  • 3 = 1111 same as 8, 9
  • 4 = 1110
  • 5 = 0111 same as 6
  • 6 = 0111 same as 5
  • 7 = 1010 same as 1
  • 8 = 1111 same as 3, 9
  • 9 = 1111 same as 3, 8

As noted above, bit 4 of bytes 1 through 4 are all associated with a decimal point for one of the digits, or the negative sign. The upper three bits of bytes 1 through 4 appeared to change with the digits, but the pattern doesn’t make obvious sense. They’re not binary representations of the numbers 0 through 9. But if you lay them out on a seven-segment LCD pattern, they begin to make sense. Figuring this out took some drawing of numbers, and guesswork. The digits with a common pattern – for example, 3, 8, and 9 – all have segments in common. That led me to look at the three changing bits in the previous bytes. Sure enough, those bits changed predictably with the digits as well. Starting with byte 1, each digit is made up of the high three bits of one byte, and the lower four bits of the next byte. Going clockwise from the upper left, the segments’ bits are as follows, for digit n:

  • Left upper: byte n bit 0
  • Center: byte n bit 1
  • Left lower: byte n bit 2
  • Bottom: byte n bit 3
  • Decimal point: byte n bit 4
  • Right lower: byte n-1 bit 5
  • Right upper: byte n-1 bit 6
  • Top: byte n-1 bit 7

The diagram below shows you the layout of which bits control to which segments:

The segments of a seven-segment LCD shown, labeled with the bit that controls each segment.


With this knowledge, I could make a case statement that would extract the correct digit from the binary values. Here it is:

// parse the value of a digit from the bits in bytes 1-4
function makeDigit(byteValue, prevValue) {
let digit = '';
// combine the upper three bits of the first byte
// with the lower four bits of the second byte.
// bit 4 is always the decimal point, so it's ignored here:
let numberValue = (byteValue & 0b1111) | (prevValue & 0b11100000);
switch (numberValue) {
case 0:
digit = ' ';
break;
case 0b11101011:
digit = '0';
break;
case 0b1010:
digit = '1';
break;
case 0b10101101:
digit = '2';
break;
case 0b10001111:
digit = '3';
break;
case 0b01001110:
digit = '4';
break;
case 0b011000111:
digit = '5';
break;
case 0b11100111:
digit = '6';
break;
case 0b10001010:
digit = '7';
break;
case 0b11101111:
digit = '8';
break;
case 0b11001111:
digit = '9';
break;
case 0b01100001:
digit = 'L';
break;
case 0b11100101:
digit = 'E';
break;
case 0b11100100:
digit = 'F';
break;
}
return digit;
}

There are still some missing pieces. I didn’t try to find the battery, Bluetooth, or Auto-off icon bits, because they’re not useful in general operation. I couldn’t get data on the continuity beep, other than to look for 000.0 when in continuity mode. I didn’t try to remotely modify the display. This last may be possible since the characteristics are theoretically writeable without response.

The HTML Interface

I built a minimal HTML interface for the meter, just enough to show the pieces needed. A more fully-realized interface for different abilities would be a good idea. Mine is below. The elements should be self-evident. View the HTML here, or see the live preview here.

Finally, I wrote a pair of functions in a separate JavaScript document, display.js, to populate the page. I deliberately avoided any JS frameworks so you can pick your own when you make something with this. These two functions are called from the ble-ts04.js script when the meter gets new data (in handleData()) and when the meter disconnects (in disconnect()), respectively:

function fillDisplay(thisMeter) {
// Is the meter connected or not?
if (thisMeter.status !== null) {
document.getElementById('status').value = thisMeter.status;
} else {
document.getElementById('status').value = 'Connected';
}
// assemble the meter reading's value, units, and order of magnitude:
document.getElementById('value').value = thisMeter.negativePolarity
+ thisMeter.value;
document.getElementById('units').value = thisMeter.magnitude
+ thisMeter.units;
// IF measuring voltage or amperage, indicate AC/DC:
if (thisMeter.units === 'volts' || thisMeter.units === 'amps') {
document.getElementById('acDc').value = thisMeter.acDc;
} else {
document.getElementById('acDc').value = '';
}
// if measuring non-contact voltage, indicate that, and clear units:
if (thisMeter.ncv) {
document.getElementById('value').value = thisMeter.ncv;
document.getElementById('units').value = '';
}
// is auto-ranging on?
if (thisMeter.autoRange) {
document.getElementById('autoRange').value = 'AutoRange';
} else {
document.getElementById('autoRange').value = '';
}
// is the hold button on?
if (thisMeter.hold) {
document.getElementById('hold').value = 'hold';
} else {
document.getElementById('hold').value = '';
}
// what setting are you on?
document.getElementById('setting').value = thisMeter.setting;
}

// clear all the display elements except the connection status:
function clearDisplay(meter) {
document.getElementById('connected').value = 'Disconnected';
document.getElementById('value').value = '';
document.getElementById('units').value = '';
document.getElementById('acDc').value = '';
document.getElementById('autoRange').value = '';
document.getElementById('hold').value = '';
document.getElementById('setting').value = '';
}

The full project can be found on my gitHub repository. Enjoy, I hope it’s useful to someone.

Thanks to John Schimmel, Pedro G. C. Oliveira, Claire Kearney-Volpe, and Josh Miele and the Blind Arduino Blog for inspiration.

Programming a Christmas Tree

As we planned for Christmas this year, my partner suggested that maybe we should replace the lights for the tree. “While we’re at it,” she asked, “is there anything out there that’s more controllable than just the ones that twinkle on and off?”

“Well,” I said, “there are NeoPixels…”

We decided that it would be great to have a tree where the lights looked and acted like candles, flickering gently in a soft, warm glow, and fading from a bright orange down to a low reddish glow by the end of the evening. We also wanted to realize the cheesy quote from It’s A Wonderful Life that “every time a bell rings, an angel gets its wings.”

Here’s a timelapse of the tree in action:

When you ring the bell, this happens:

The process of making it gave a chance to work with:

You can find the code and circuit in the gitHub repository for this project.
Continue reading “Programming a Christmas Tree”

Node.js on the Arduino Yún

Recently, Federico Fissore added node.js to the package repository for the Arduino Yún. Here’s how you get node to communicate with the Arduino processor on the Yún via the Bridge library.

To do this, you’ll need an Arduino Yún, a microSD card, a microUSB cable and a wifi connection. You should be familiar with the basics of the Arduino Yún and node.js in order to get the most out of this post.

All of the code for this post can be found on my GitHub repository.

Continue reading “Node.js on the Arduino Yún”